Sze Hang Wong (Timothy Wong)

A dedicated and challenge loving data analyst with 10+ years of commercial experience and a master's degree in Data Science from the University of Bristol. Skillful in ETL and data analytics, I helped my team to build up our own data warehouse and automate KPI reporting, so we could focus on other ad-hoc research projects.
Currently I am keen to develop experience in work related to data science and data engineering.
Visit my LinkedIn Profile
View my CV
Technical Skills: Python, R, SQL, SPSS, Alteryx, Tableau, AWS
Previous projects in data science, machine learning and NLP
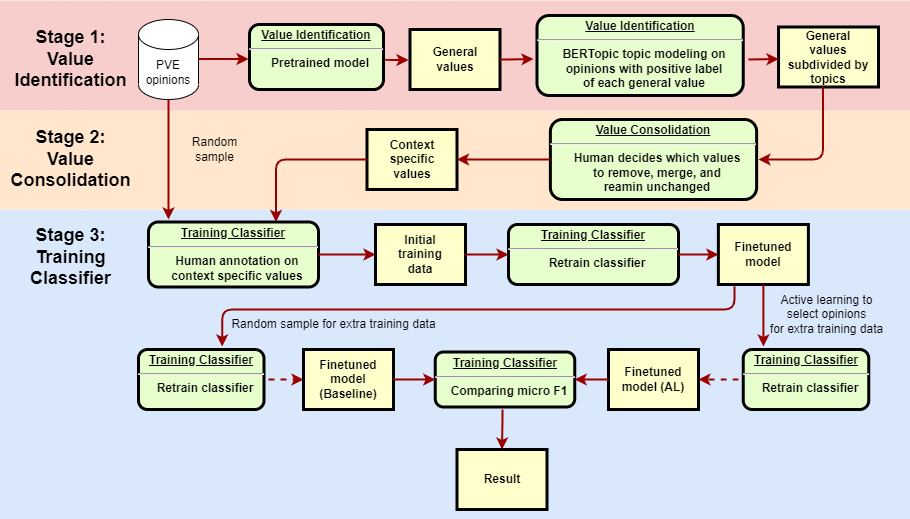
NLP project for Identifying Context-Specific Values in Arguments
Human values are broad motivational goals — when we think about values, we think of what is important to us in life. We find an argument from others as persuasive or not based on whether or not that argument promotes the values we prefer. For example, a person preferring the value of freedom may find the argument “loneliness and isolation are a bigger killer than corona” persuasive in favour of lifting Covid-19 restrictions. Value preferences, however, are context specific. A person with a preference for freedom over safety in Covid-19 context may prefer safety over freedom in another context. This project seeks to create a highly computerised method to identify context-specific values in arguments.
This github repository consists of all the data, models and python code to recreate my MSc Data Science project for “Identifying Context-Specific Values in Arguments”. This project heavily relys on BERT (Bidirectional Encoder Representations from Transformers) models, which is a Neural Networks Model, to identify human values under text documents.
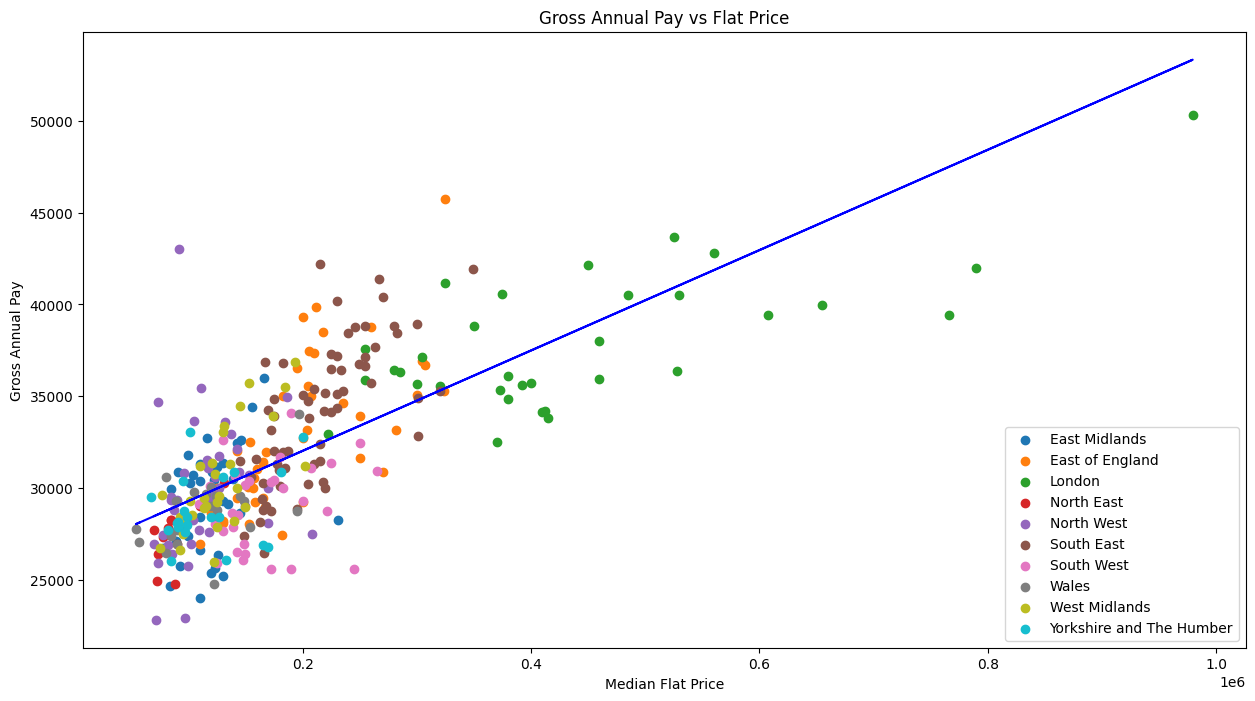
Analysing the best places for young people to live in England and Wales
University students graduate in every September (including myself). Before that, they need to decide where to live and work. In this project, analysis on house price, salary, residents’ age, suicide rate, and personal well-being estimates on every local authority in the England and Wales. The results show that if higher salary is desired but affordability for housing is limited:
- For higher disposable income, you may consider St Albans in Hertfordshire, Copeland in Cumbria, and Surrey County to take advantage of the high pay jobs.
- For young age and low suicide rate, Thurrock from Essex is outstanding.
- For overall performance for the rent paid, other than Cumbria County and Thurrock mentioned above, local authorities in the outskirts of London (South East and East of England) can be the choices.
- Fareham is a new discovery. Located between Portsmouth and Southampton, it is benefitted from the job opportunities from these 2 cities.
Geospatial and cluster analysis of the best places for Data Science graduates to live in England and Wales
This data visualisation work on Tableau is a follow-up of the previous project. It aims to utilise the visualization of geospatial data and cluster analysis to provide necessary and relevant information for the users (MSc Data Science students) for the decision process of selecting better areas to live. Three goals would be achieved from the data visualizations:
- Provide an overview of the distribution of the qualities (residents’ age and job opportunities) that users (MSc Data Science students) may considered by local authorities.
- Use dimensionality reductions and clustering methods to categorise the local authorities into clusters based on the related qualities, for users to understand the correlations between qualities and characteristics of each cluster. This could help them to select the target cluster.
- Select the best local authorities that perform better in most of the related qualities.
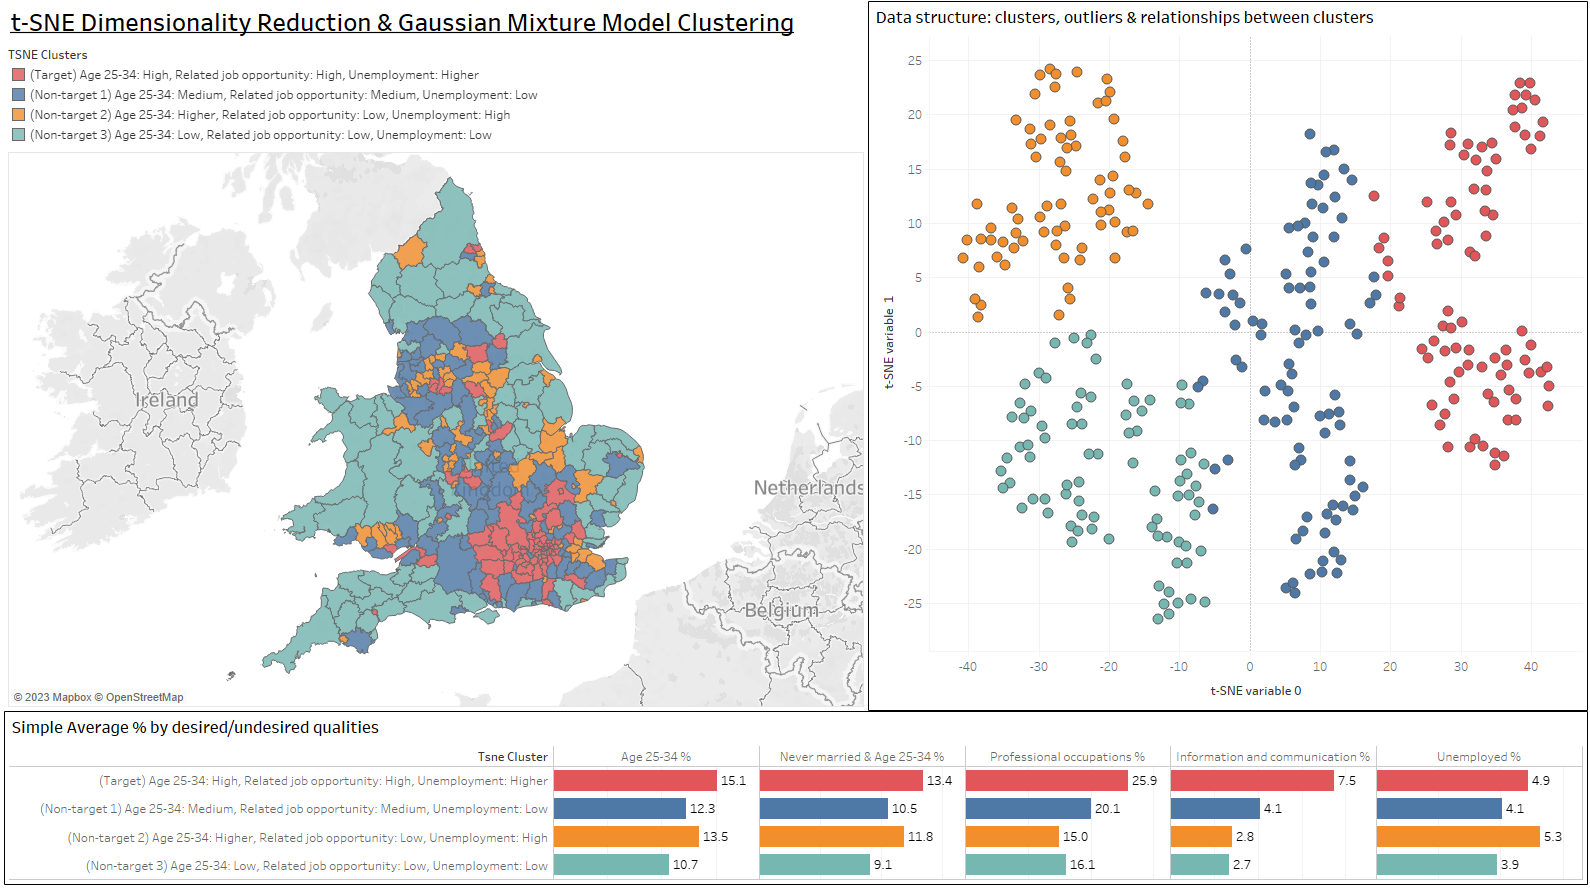 The cluster of local authorities in red colour has the best performance except higher unemployment rate.
The results show that:
- The local authorities in the target clusters are mostly located in London/South East regions, which consists of 55 out of 85 (65%) local authorities in the target clusters (London=29, South East=26). If East of England is also included, the proportion is increased to 66 out of 85 (78%). It could be concluded that top local authorities for the users were concentrated around London area.
- It might not be worthwhile to live in local authorities in the target clusters that are far from London. These local authorities do not have many neighbouring local authorities in the same target cluster (the highest number is 4 in Greater Manchester), so users may not be benefited from relevant job opportunities and have friends of similar age range from neighbouring local authorities, while they can have these advantages in local authorities around London.
- Low unemployment rate and higher proportion of population in similar age range should not be overly pursued. From one of the low dimension representation variables, it was discovered that unemployment rate was positively correlated with the proportion of population aged 25-34. Therefore, a balance between the two requirements should be achieved, as a local authority that did well in one aspect was likely to be awful in another aspect.
Download Tableau visualisation
Previous commercial projects
A selection of analytical projects on the company’s internal data.
ETL, Data warehousing and KPI reporting automation:
- Carried out ETL and data cleaning on internal data from different departments to form a data warehouse for further analysis.
- Automated KPI metrics calculation and visualization for KPI reporting.
Achievements:
- Utilised SQL, SPSS scripts and Alteryx to reduce the KPI metrics calculation time by 40%, from 5 to 3 days.
- Enabled the KPI metrics calculation to be handled by colleagues with less programming experience by highlighting key values in scripts to be changed and showing workflow in Alteryx, to optimise human resource allocation.
Forecasting (simulation):
- Forecasted club members’ age and other interlocking demographic distributions in the next 3 decades to evaluate the impact of baby boomer on the club’s member composition and estimate the lifetime value of members.
- Conducted by taking incoming and outgoing rate of citizens by interlocking demographic as assumptions, and simulating the incoming and outgoing processes year by year.
Achievements:
- Predicted the multidimensional demographic changes in the next 3 decades for taking pre-emptive measure.
- e.g. Increased 50% new membership applications to be processed (300 to 450 per year) for additional entrance fee, subscription fee and business to prepare for the upcoming inactivity of members from baby boomer.